Understanding Nutrient Pollution
Nutrients of Concern
Nutrients like nitrogen and phosphorus are essential building blocks of life, but in excess they can severely disrupt aquatic and terrestrial ecosystems. Understanding how these nutrients move through the environment—and how human activities have altered their natural cycles—is critical to designing effective management strategies. This appendix provides a foundation for understanding nutrient pollution, its causes, and its impacts in Sarasota County and beyond.
Excess nutrients can pollute waters and soils and fuel harmful algal blooms, with severe consequences for estuarine ecosystems such as Sarasota Bay. In Sarasota Bay, eutrophication driven by nutrient pollution has contributed to seagrass loss, macroalgae blooms, and more severe and longer lasting red tide blooms which have cascading effects on fish populations and Sarasota Bay’s resident dolphins— the longest continuously studied wild dolphin population in the world.
Two nutrients of primary concern are phosphorus and nitrogen, derived from both natural and human (anthropogenic) sources. Because soils in Sarasota County are naturally rich in phosphorus, nitrogen is the primary concern for limiting algal growth. In other regions of Florida, phosphorus is of greater concern. Understanding the local hydrogeologic conditions and the site-specific occurrence of these nutrients is essential for developing an effective nutrient management program.
Nitrogen
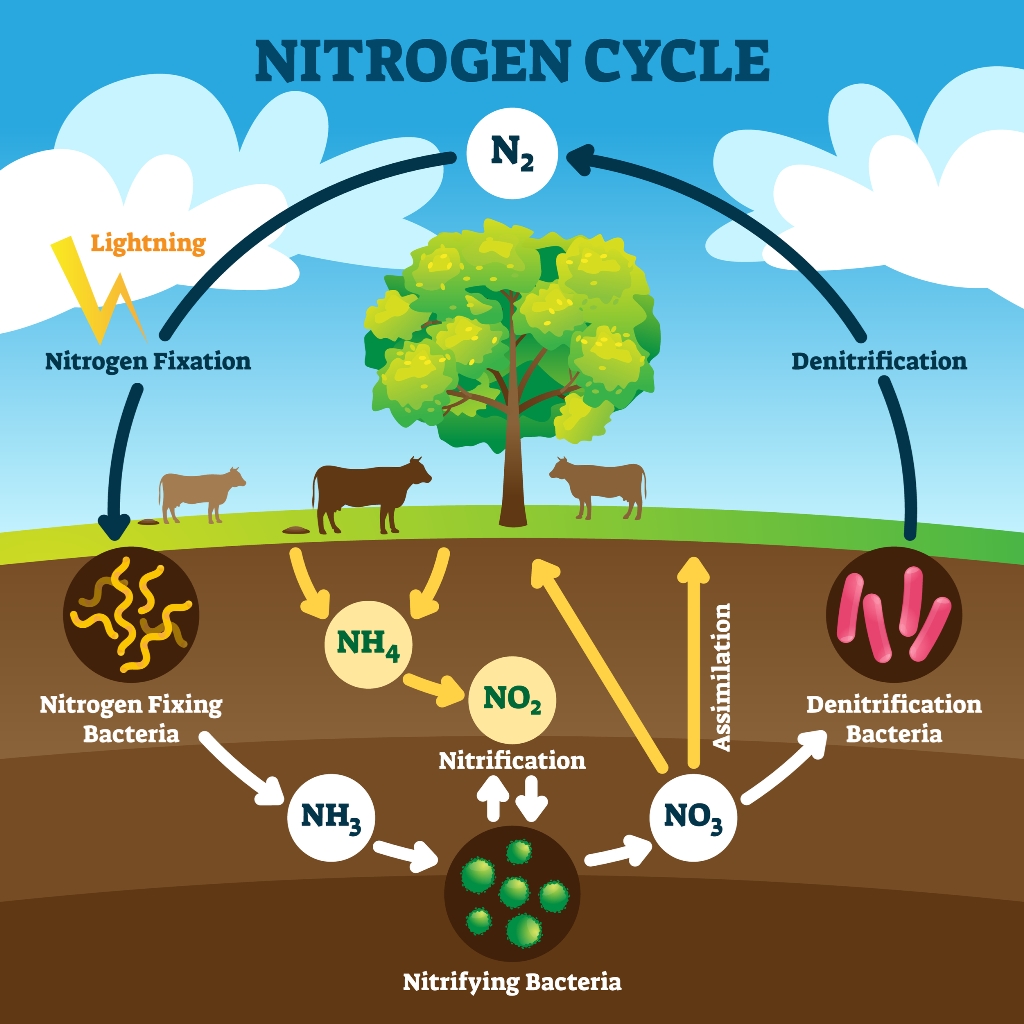
The nitrogen cycle transforms nitrogen into various chemical forms as it moves through air, soil, water, and living organisms (Figure 1). Earth’s atmosphere is composed of 78% nitrogen gas, which must be “fixed” into a usable form for plant uptake. While lightning can fix nitrogen gas naturally, most fixation occurs when bacteria combine nitrogen with hydrogen to produce ammonia. Ammonia can also form through bacterial decomposition of plants, animals, and their wastes. Other types of bacteria “nitrify” ammonia into nitrite and nitrate, which plants readily use. Nitrates are highly soluble in water and easily transported by groundwater. Conversely, “denitrification” by bacteria converts nitrates back to nitrogen gas, completing the nitrogen cycle. Denitrification is critical for cycling nitrogen from soils and waters back into the atmosphere, where it is unavailable to fuel algal blooms. Lengthening the cycle by locking nitrogen into plant and animal tissue (bioassimilation) also reduces nitrogen availability.
Figure 1. The nitrogen cycle in soils and atmosphere. Denitrification is the key to cycling nitrogen from soils and waters back into the atmosphere, where it is unavailable to feed algal blooms. Lengthening the cycle by locking up nitrogen in plant and animal tissue (bioassimilation) can also reduce nitrogen availability for algal blooms.
Human activities have significantly altered the natural nitrogen cycle through fossil fuel combustion (see Chapter 5), synthetic fertilizer production (see Chapter 4), and wastewater treatment (see Chapters 1 and 2). For example, the industrial Haber-Bosch process produces ammonia fertilizers by “fixing” nitrogen gas and hydrogen under high pressure. Since the 1950s, global production of reactive nitrogen via this method has increased dramatically to more than 150 million tons per year. While synthetic fertilizers have fueled global food production and supported a growing population exceeding 7.8 billion people, they have also contributed to widespread water quality degradation. Overreliance on fertilizers has further degraded soils by reducing natural microbial health in both urban and agricultural settings. Improving soil health and reducing nitrogen-based fertilizer applications are key strategies for mitigating nitrogen pollution (see Chapter 4).
Conventional septic systems and older centralized wastewater treatment facilities using secondary treatment rely on bacteria to convert some nitrogen to nitrogen gas. However, reactive nitrogen often remains and leaches into soil and water. Advanced septic systems and advanced wastewater treatment technologies convert significantly more nitrogen before environmental release (see Chapters 1 and 2).
Aquatic systems in Sarasota County are particularly sensitive to nitrogen inputs. Excess anthropogenic nitrogen fuels micro- and macroalgal blooms that block sunlight, deplete oxygen, degrade water quality, and kill aquatic life (Figure 2).
Figure 2. Increasing nutrients feed algae that cloud the water and reduce light availability for seagrass. Without adequate light, seagrass meadows die off along with the fish and wildlife they support.
Some algae release toxins that directly kill aquatic life and can significantly threaten human health. Impacts to human recreation, economies, and fisheries can be profound.
Effective strategies to reduce excess anthropogenic nitrogen loading include:
- Improved wastewater treatment
- Restrictions on fossil fuel emissions
- Improved fertilizer management
- Improved biosolids treatment and management
Phosphorus
Phosphorus naturally occurs in oxidized minerals such as phosphate rocks. Humans mine phosphorus from natural deposits to manufacture fertilizers, detergents, pesticides, and other products. Organic sources, such as livestock manure and wastewater biosolids, have been used as fertilizers for centuries.
Sources of nitrogen and phosphorus.
Phosphorus tends to bind with soil minerals but can also seep into surface waters through groundwater flow. Soil erosion significantly contributes phosphorus to waterways, with flood-induced bank erosion transporting phosphorus-rich sediments downstream.
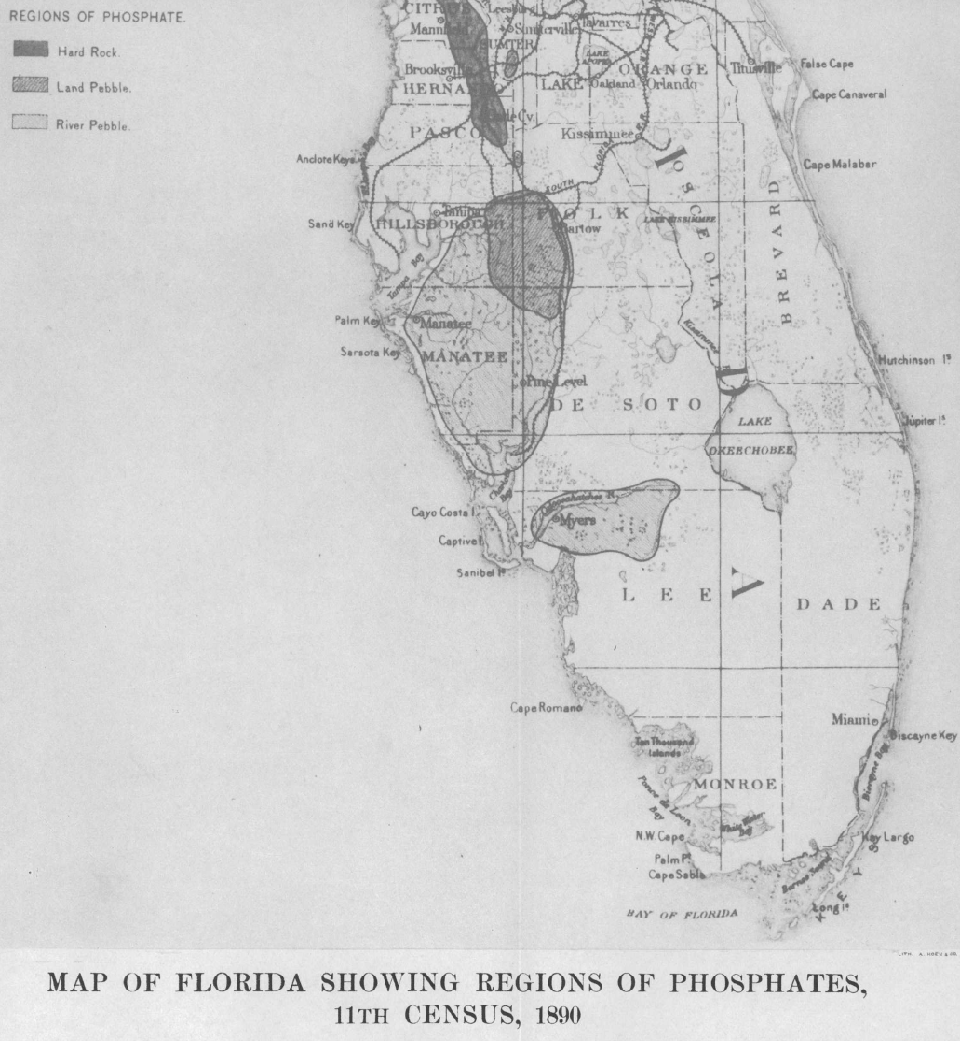
Sarasota County lies within the Bone Valley of the Hawthorn geological formation, an area naturally rich in phosphorus. The richest phosphate deposits are located in Polk County, where mining has occurred for decades.
The Bone Valley region of west central Florida extends into Manatee and Sarasota Counties with major hard rock deposits in northeastern Manatee County and southern Polk County. Sarasota County prohibits phosphate mining.
Over millennia, local ecosystems have adapted to high natural phosphorus concentrations. As a result, photosynthetic growth in Sarasota County is typically not phosphorus-limited, and landscapes such as lawns, urban plantings, and golf courses often thrive without supplemental phosphorus fertilize. Nevertheless, many aquatic systems remain sensitive to excess phosphorus inputs, which can trigger harmful algal blooms, oxygen depletion, and aquatic mortality.
Effective strategies to reduce excess anthropogenic phosphorus include:
- Use of Advanced Wastewater Treatment
- Restrictions on phosphorus detergents
- Improved fertilizer management
- Improved biosolids treatment and management
Quantifying Nutrient Pollution
Nutrient Load Measurements
The annual land-based nutrient load to receiving waters, such as Sarasota Bay, is a function of the annual runoff volume and the nutrient concentration within that runoff. Therefore, accurate data on both water quantity (flow) and water quality (nutrient concentrations) are necessary. Longer periods of record yield more precise estimates of annual variability and long-term trends.
Fortunately, Sarasota County has established an extensive watershed monitoring program (Figure 3) (see Chapter 10.1). Initiated between 2004 and 2007, this program provides almost two decades of data on nutrient loads. Additional state (e.g., Southwest Florida Water Management District, Florida Department of Environmental Protection) and federal (e.g., U.S. Geological Survey) monitoring stations supplement these datasets. For example, the USGS has operated a continuous streamflow gage on the Myakka River north of State Road 72 since 1939.
Figure 3. Location map and inventory of Sarasota County’s network of water quality and water flow sampling stations. Source: Sarasota County Water Atlas
Nutrient Load Estimation
Gross nutrient loads are typically estimated by applying land use-specific event mean concentrations (EMCs) to average annual runoff volumes. EMCs were established by the State of Florida based on runoff sampling from various representative land uses.
Another approach, developed by the South Florida Water Management District (SFWMD), uses nutrient budget coefficients for imports, exports, retainage, and discharge, also specific to land uses. These coefficients were developed through surveys and interviews with land use managers in collaboration with the Florida Department of Agriculture and Consumer Services (FDACS).
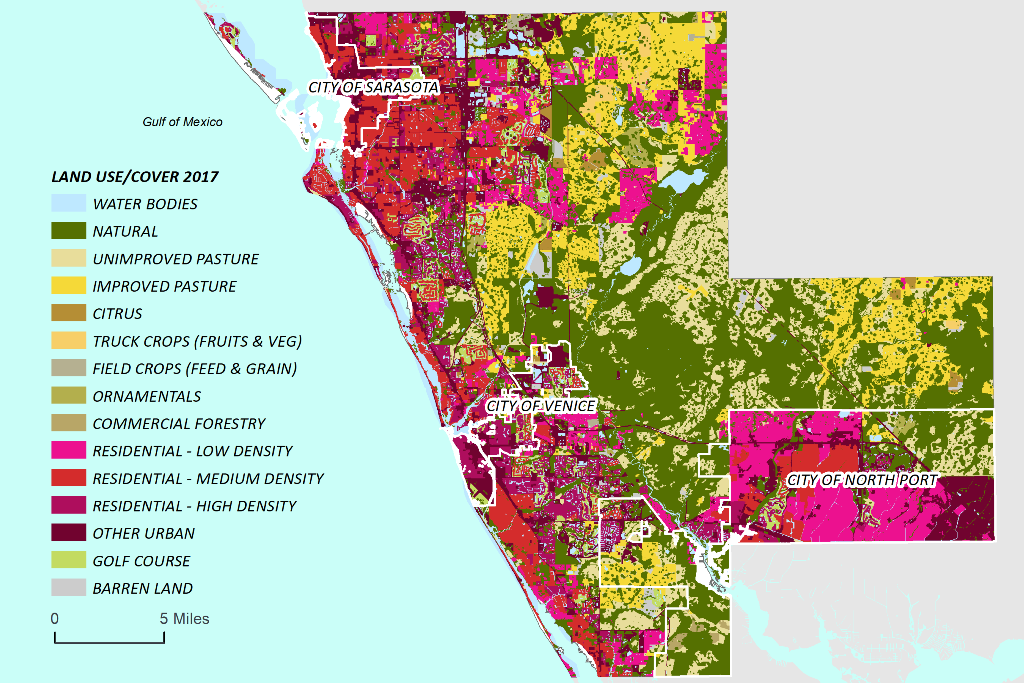
Both approaches require accurate estimation of hydraulic loading based on land use and cover. The Florida Land Use, Cover and Forms Classification System (FLUCCS) inventory provides the land use/cover maps for Sarasota County (Figure A-3). Land use/cover categories have been aggregated to align with the state’s adopted EMCs and/or the nutrient budget coefficients.
Figure 4. The 2017 land use and land cover map for Sarasota County. Source: Southwest Florida Water Management District
Gross load estimates assume average annual hydraulic loading, acknowledging that year-to-year variations occur. Importantly, significant discrepancies exist between annual gross nutrient loads estimated by different methods. Calibration to actual monitoring data is critical to ensure models accurately represent local conditions. Once calibrated, these models can support scenario planning, such as evaluating changes in land use or implementing nutrient reduction strategies. Developing a “pre-development” baseline land cover map using historical surveys and soil data could further enhance long-term nutrient management planning.


